Plotting
The plots module provides useful plotting utility functions for visualizing calibrated models.
Feature Calibrators
For any calibrated model, you can plot feature calibrators. The plotting utility will automatically determine the feature type and generate the corresponding calibrator visualization:
| Categorical Calibrator | Numerical Calibrator |
|---|---|
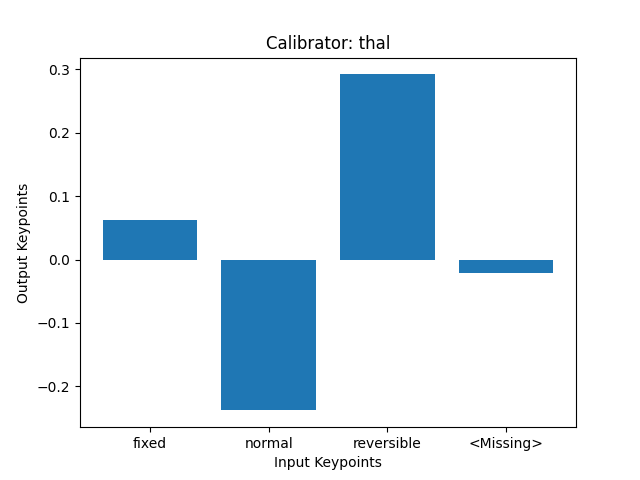 |
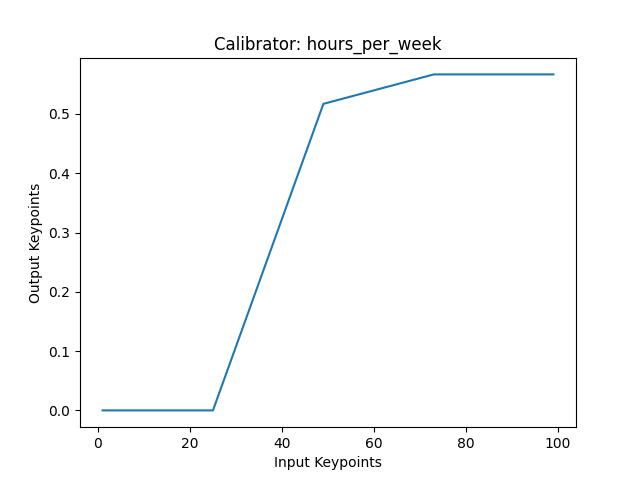 |
The calibrator(...) function expects a calibrated model as the first argument so that you can use these functions even if you train a calibrated model manually without the Classifier class.
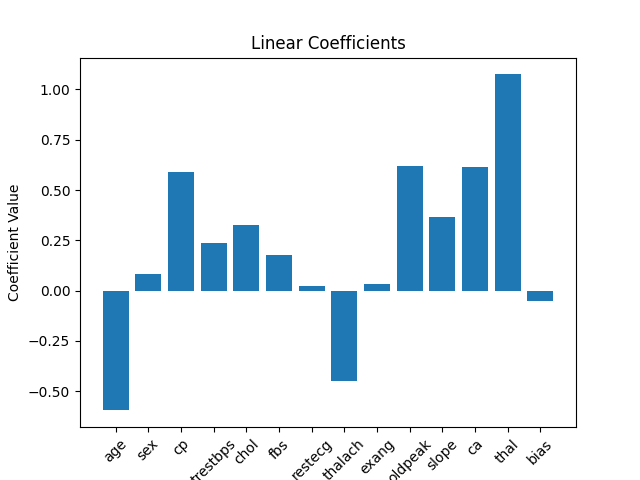
Linear Coefficients
For calibrated linear models, you can also plot the linear coefficients as a bar chart to better understand how the model is combining calibrated feature values: